
Here is a graph of the temperature in Melbourne over the last couple of days. It's been pretty hot, which is why I first made a graph by pasting some data from the australian bureau of meterology website:
http://www.bom.gov.au/
The vertical axis shows degrees celsius and the horizontal axis shows time in hours EST. (*)
I just wanted to visualise it a bit and also watch as well as feel for that lovely moment when it starts to drop, compare it to yesterdays profile, etc.
Please note that I selected the 'B-splice' option when graphing it, so this graph is smoother than the actual measurements warrant - but this is also probably a more realistic look for a general sense of what temperatures do.
You'll notice that it appears to have jumped up 3 degrees quite late in the evening, between 11:30pm and 12:00 midnight on Dec 31st. This is not deceptive, it really did go up that much, at least if the bom published observations are anything to go by!
(Please someone let me know if the following links are broken!)
The original data is mostly taken from the following part of the site , which lists observations on the half-hour for the previous 72 hours:
http://www.bom.gov.au/products/IDV65360/IDV65360.94868.shtml
The exception is a couple of in between measurements which I added manually from the 'bleeding edge' last 10 minute observations at:
http://www.bom.gov.au/products/IDV60034.shtml
(the disadvantage of this one is that, while very fresh, it is just the single measurement )
Anyway, I had my reasonably nice little graph for my own purposes which gave me a feel for how today compares to yesterday.
Bill then suggested for his own insane reasons that I could put it on my blog, and I found myself strangely unable to resist the idea. Even though it meant I had to muck around a whole lot more to make it more presentable ;)
Yes, I know there's a big pink bit around it. I'll see if I can fix this later.
So far, I've simply cut the chart out of openoffice calc, pasted it into openoffice draw, fiddled a little, then exported the resulting openoffice 'draw' file as a gif.
This was done on the principle of 'Do the simplest thing that could possibly work'. And it did work. Kinda.
Is it just me, or, despite surface appearances to the contrary, does OO calc work in a manner that is almost, but not quite, entirely unlike MS excel?
Or am I just a crazy monkey pounding a keyboard? ;)
Maybe if I have time I'll write something that scrapes the temperature data straight off the bom site and graphs it here. Maybe not. Regardless of the probabilities though I almost certainly probably should go to bed soon.
(EST = Eastern Standard Time, which is defined as utc + 10 hours, or '10 hours ahead of Coordinated Universal Time'. It is also sometimes referred to as AEST = Australian Eastern Standard Time.)
And now for something completely different...
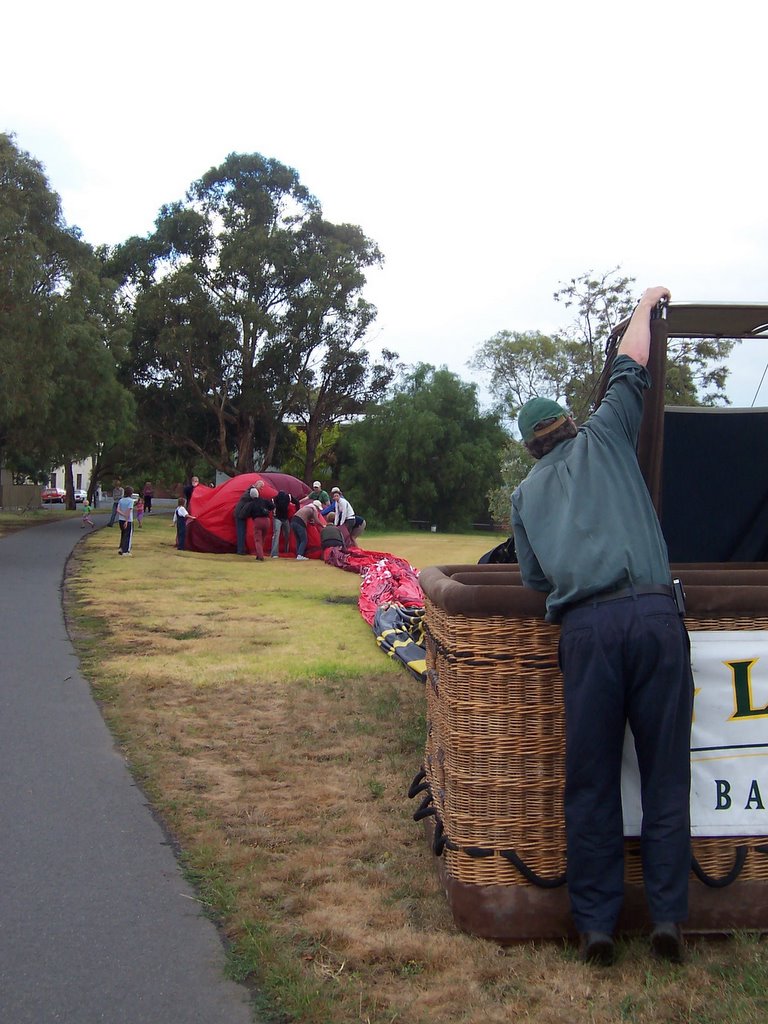
Here is the photo of the emergency balloon landing described in Kerry's comment to this post:
posted by Wendy Langer @ 2:59 AM
![]()
![]()
2 Comments:
Nice graph!
Your blog makes sense so you're probably not a crazy monkey pounding the keyboard IMHO :-)
It's cooler today so stop sipping champagne in the bath and blog some more!!
A hot air balloon came down in the park behind my house early this morning! It was enormous, I hadn't realised how big those balloons really are.
There was not enough wind and the pilot said they were running out of gas.
That was a bit exciting! It woke me up so I didn't have my planned sleep in. Instead I ran across the road and dragged Marilyn out of bed. Then we went and watched the balloon as it deflated. The pilot organised all his passengers into a team to help him roll the balloon up. Then it was packed into quite a small bag. A minibut and trailer arrived to transport balloon, basket and passengers to wherever they were supposed to end up.
don't know why I'm writing about it here, but it's sort of about the weather (no wind).
Marilyn took a photo I think so perhaps you could put it on your blog.
Post a Comment
<< Home